Early start stole the show
YBS (0025) closed at 0.33 on July 1, 2021.
Japanese candlestick chart shows a white candle, signaling a buy.
Momentum indicator rises, the banker fund is over 10%, reinforced that this is a buy signal.
The following day, i.e. on July 2, members bought 10,000 shares at the opening price of 0.33.
T+6, that is, on July 12, YBS opened at 0.385, then soared to a high of 0.555, and then gradually retreated. Members saw that the stock had retraced six bids to 0.53 so decided to sell it at the mentioned price for a profit of 1928.06. The ROI is 57.82%.
On July 30, the stock hit a low of 0.405 and closed at 0.415.
The Momentum indicator curve has gone to a low point, and the Banker Fund has also fallen to a low level. This is a sign that you should try to enter.
July 30 is Friday. Members have to wait for 2 days, Saturday (July 31) and Sunday (August 1st) before buying 10,000 shares at the opening price of 0.415 on the morning of Monday, August 2.
T+3, that is, on August 5, YBS opened at 0.46, after that rises to the high of 0.49, and six bids from the day high is 0.465.
Since the low point of the day was 0.45, I advised members to close their position at 0.48 before 4:45pm.
This trade, the net profit is 577.95, and the ROI is 13.81%.
The next day, the stock price fell and the Banker Fund retreated.
On August 2, we saw Banker Funds began to flow in, and the stock closed at 0.48.
The Momentum indicator is curved up, and the stock price has rebounded from the bottom. These 3 points alone can be used as a buy signal.
Therefore, my member bought 10,000 shares at the opening price of 0.48 on August 3.
T+4, on August 9, the stock opened at 0.525, the highest rose to 0.575, and 6 bids from the top was 0.55, but the stock finished at 0.565.
I noticed that the Momentum index had deviated, meaning that the stock price had increased but the momentum index had decreased, and the trading volume had increased dramatically. As a result, I asked the member to sell at 0.565 before 4:45pm.
This time this transaction can make a net profit of 776.50, ROI of 16.06%.
It's easy to understand how we play. We'll have to leave the market on August 11 if we don't exit on August 9.
August 11 is a Monday. The market began at 0.555, rose to 0.57, and then began to fall. It is 0.545 if you count six bids from day high. That is, if you do not exit at 0.545 before the market ends, you can exit the market at 0.50.
Traders must have the ability to make decisions. They will not make money if they hesitate too much. The stock eventually tumbled.
The Momentum indicator showed that momentum fell to its lowest point on August 24, and the stock price hung at 0.41.
However, the stock price has not yet reached its lower point. The stock price fell to 0.39 on August 27 before it stopped and closed at 0.395 on the same day.
On September 6, 10% Banker Fund appeared. The stock closed at 0.435 on that day.
On September 7, the stock closed at 0.42, the Banker Fund faded, but the hot money remained at 70%, and 30% fund belonged to retail investors.
Since the banker has entered the market on September 6, it means that this stock has attracted the attention of the major players. If we follow the market, we can sell at 0.50 or even 0.57, depending on the situation at that time.
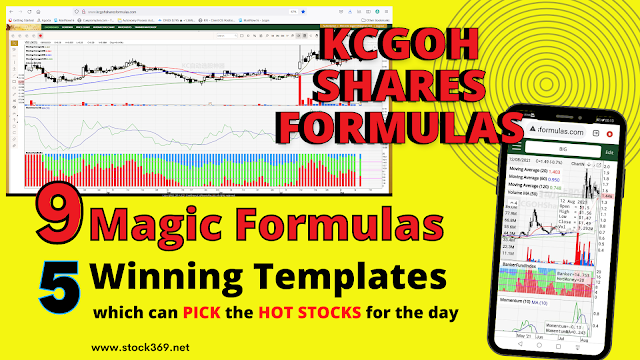
With effective tools, you can generate good income from stock market. I have launched the Best Auto-Stock-Pick Software, with 9 Magic Formulas and 5 Strategic Templates to help you pick the best stock to trade!
I also have [Stock Market Expert Practical Training Course], where I will guide you to do the real trade, you will learn practical knowledge and techniques to trade and make real income from the stock market.
I am KC Goh, Please contact me directly at 012-659 7910.
You can also click here to whatsapp me: https://wa.me/60126597910


No comments:
Post a Comment